|
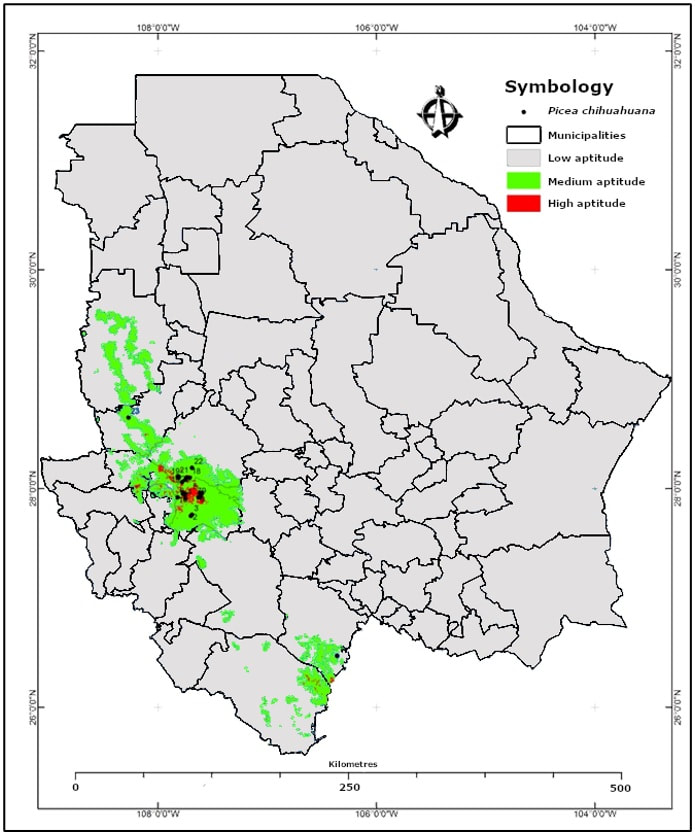
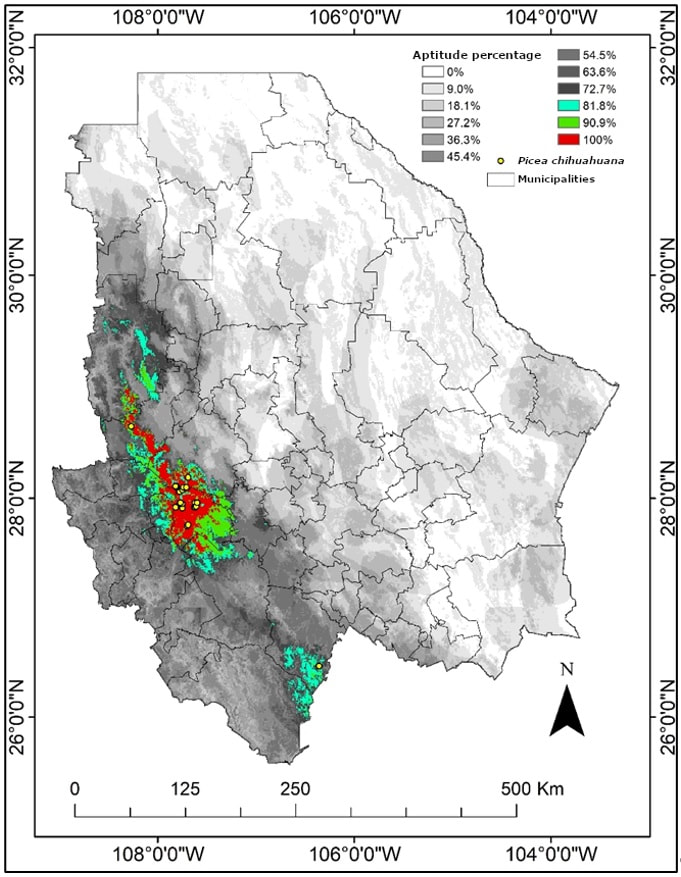
The Species Distribution Models (SDM) are a cartographic representation of the suitability of a space for the presence of the species, based on the variables used like climate and soil types. Suitability is nothing more than the statistical relationship between the real known distribution and a set of independent variables that are used as indicators. In this study, we seek to evaluate the functionality and feasibility of the Climpact methodology (CDS SDM Toolbox) for the elaboration of potential distribution models of species, by means of comparison with the results of the Maxent model. We calculated the potential distribution of Picea chihuahuana in the state of Chihuahua with both methodologies. This tree is endangered, and it’s an endemic relic totally or almost confined to a natural area. The results are the following: Potential distribution model of Picea Chihuahuana with Maxent The Climpact methodology generates tables for each continuous variable, showing the minimum and maximum value observed in the records. The final result of the Climpact methodology is the potential distribution model, which indicates the percentage of optimal conditions for the distribution of the species. The results are the following: Potential distribution model of Picea Chihuahuana with CDS SDM Toolbox (Climpact) The results in both methodologies (Climpact and Maxent) are similar in terms of shape and spatial location, concentrating on the municipalities of Bocoyna, Maguarichi, Guerrero and Ocampo and a region in the southwest of the State. However, with the Climpact results, you can observe easier the potential areas with higher aptitude.
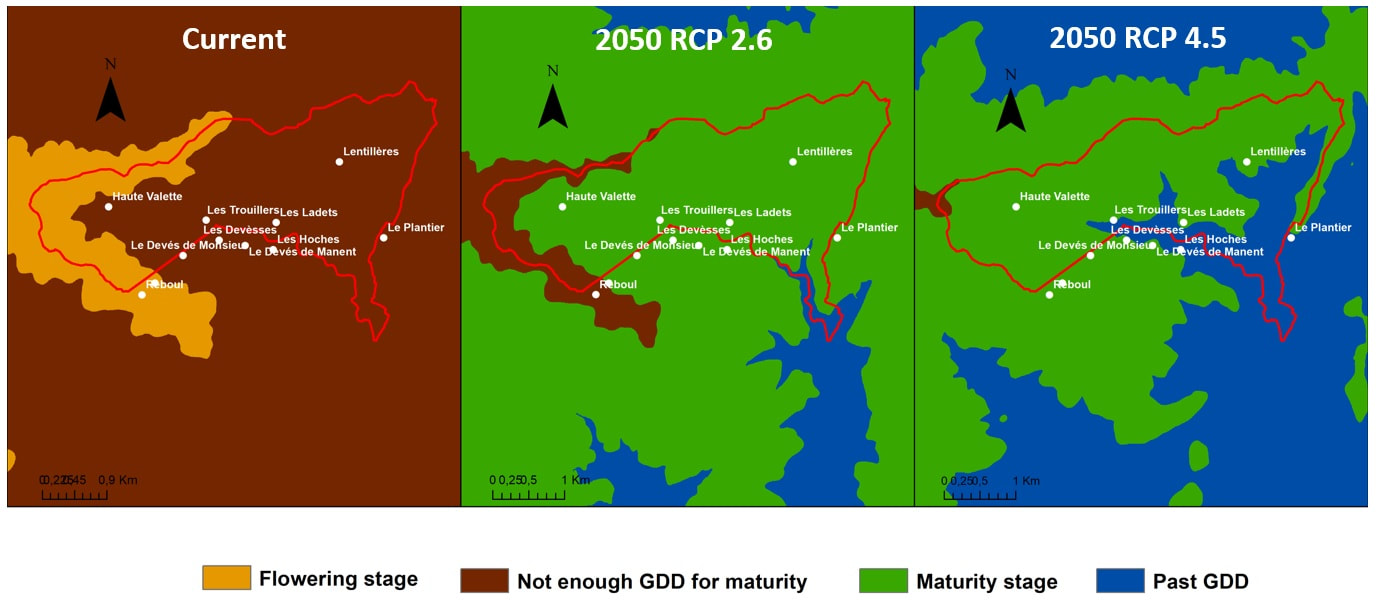
The distribution area of the Picea chihuahuana, produced by Maxent, is smaller than the one of Climpact. Climpact proposes a more friendly, established and understandable methodology, which is why its result is easier to interpret compared to Maxent. Likewise, Maxent's algorithm is much more complex and difficult to process. One of the main challenge for the next decades will be the resilience of the food supply chain. The first element of this system is the agricultural productivity like cereals. We propose here an example of the application of our methodology for estimating the impact of climate change on maize (Zea mais) in a municipality of Archèche (France). This methodology is based on the two following steps:
The cultivation cycle ends in September.
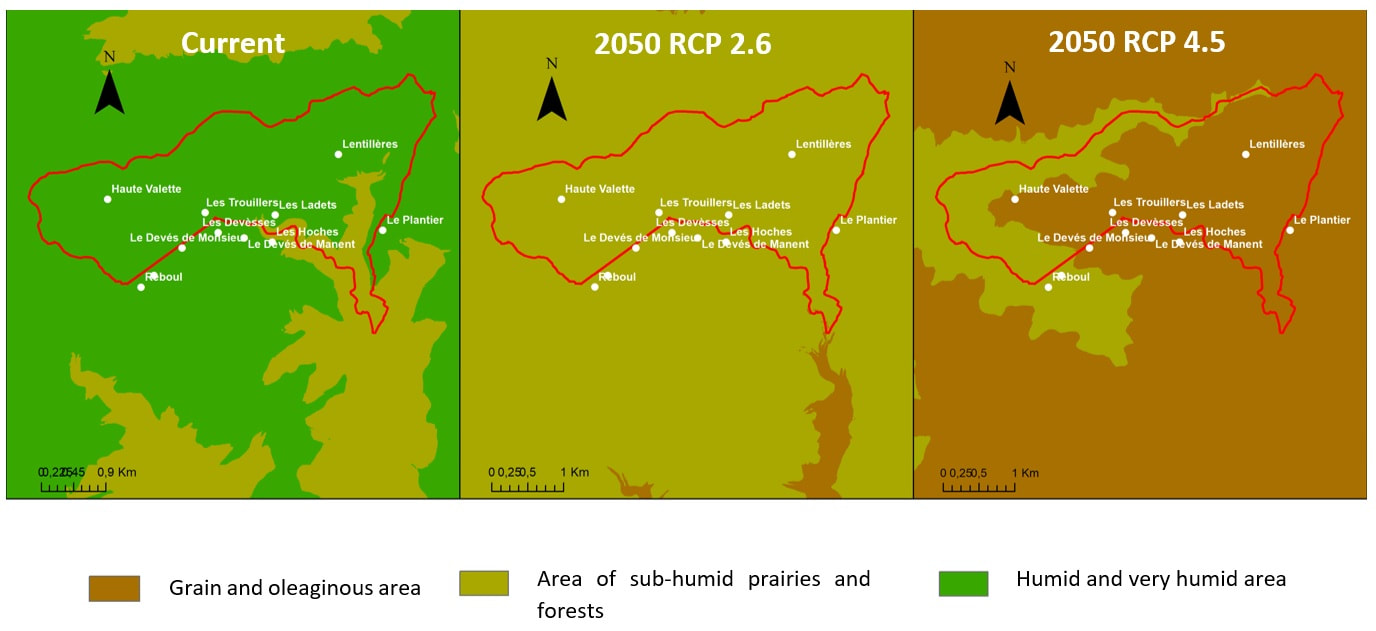
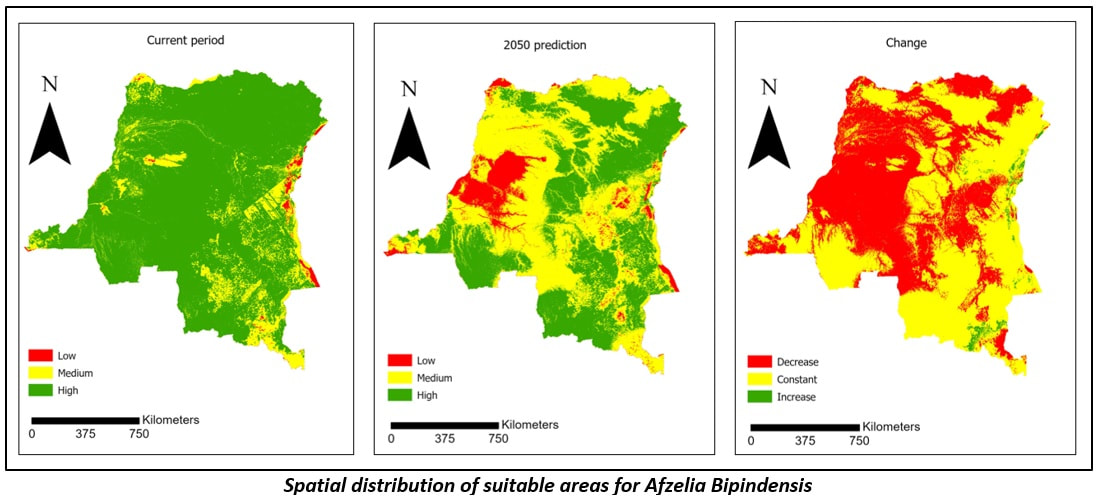
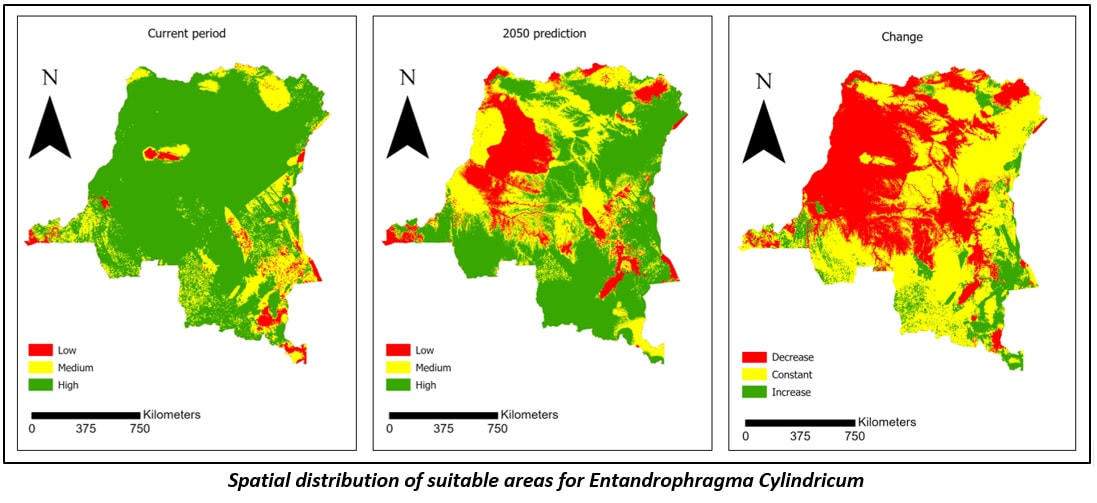
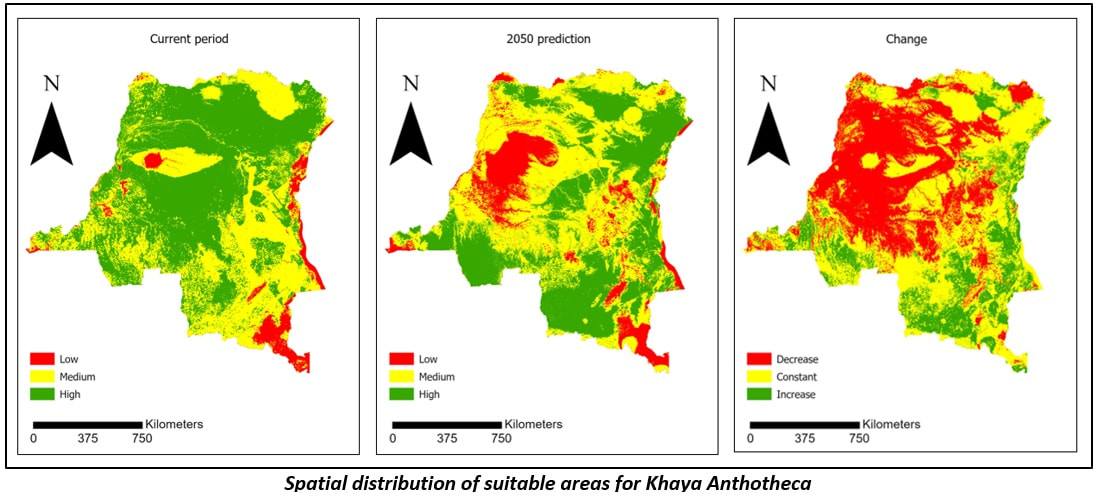
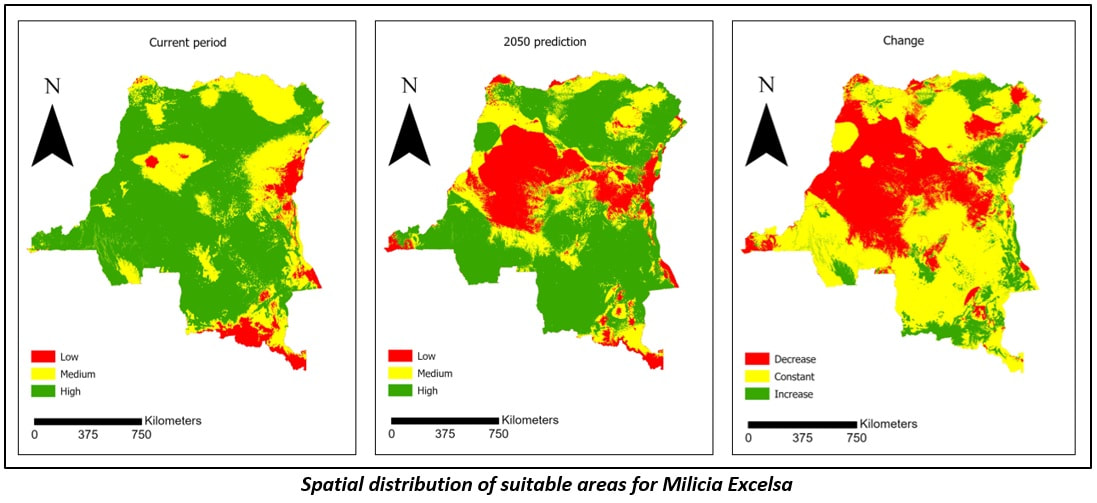
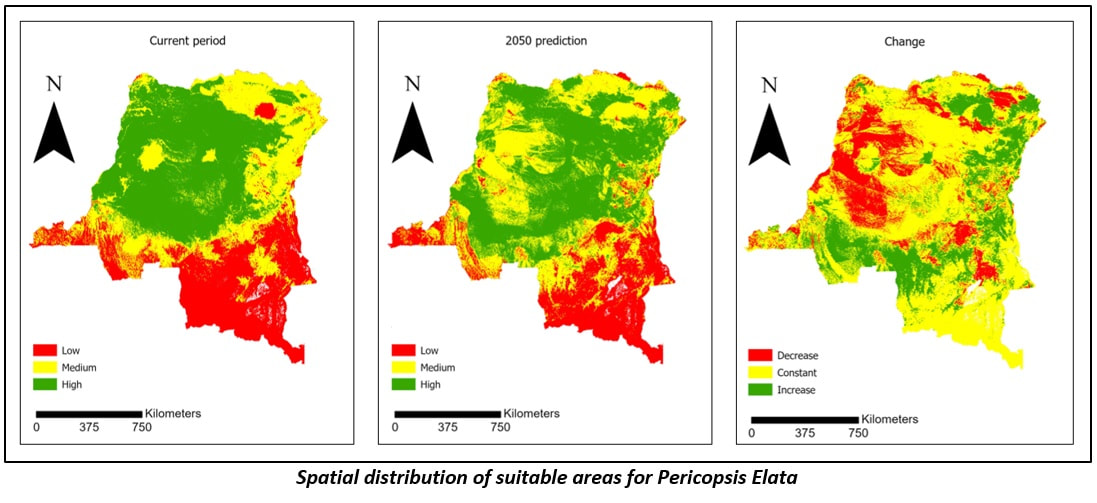
The blue cluster indicates the areas where the flowering period will be exceeded. The brown cluster represents areas that won’t have enough Growing Degree Days (GDD) for joining the maturity condition. The green cluster shows areas that will join the maturity stage. In this territory, the current period is not suitable for cultivating maize, apart in the West side of the municipality. In the future, the territory should be more suitable for the cultivation of maize in almost all areas of the municipality. The application of the Martone Aridity Index indicates similar results and the general suitability of the territory for cultivating cereals in the future. The DRC’s forest ecosystem constitutes one of its greatest assets as it provides ecological and socio-economic services to its population. Climate change is expected to impact the future distribution of tree species. In this study we assessed the impact of climate change on the future distribution of selected five timber species (Afzelia bipindensis, Entandrophragma Cylindricum, Khaya Anthotheca, Milicia excelsa and Pericopsis elata) located in the DRC using the RCP 6.0 climate change scenario.
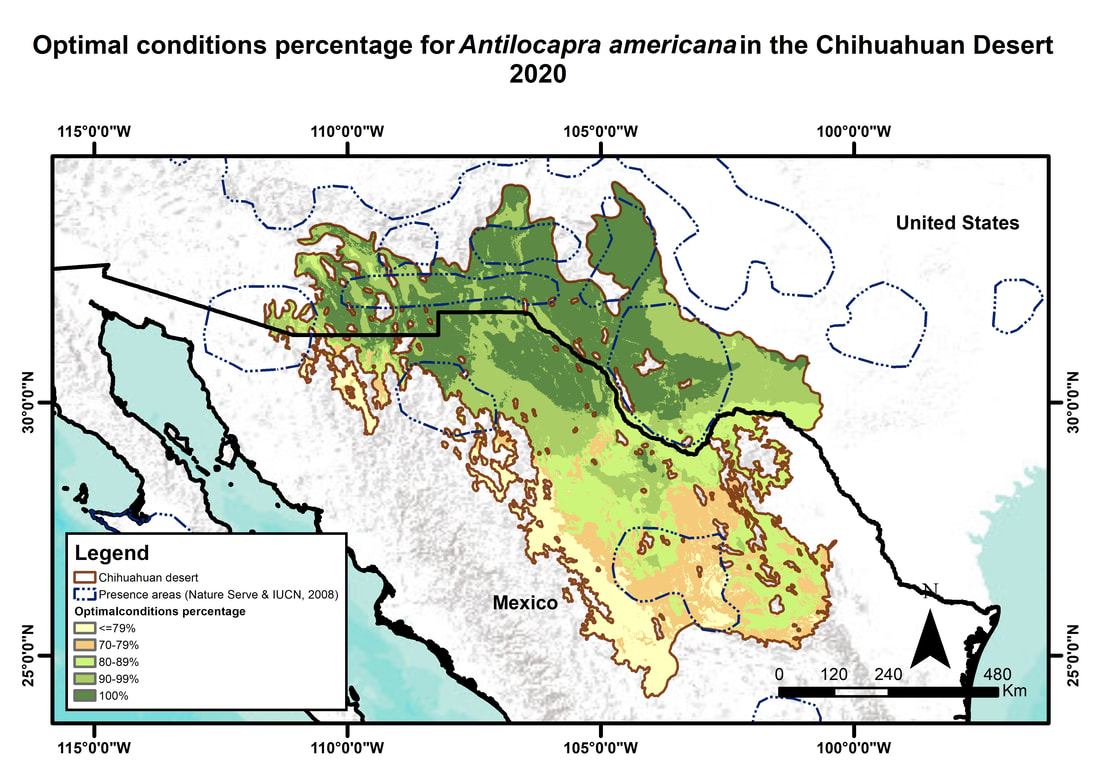
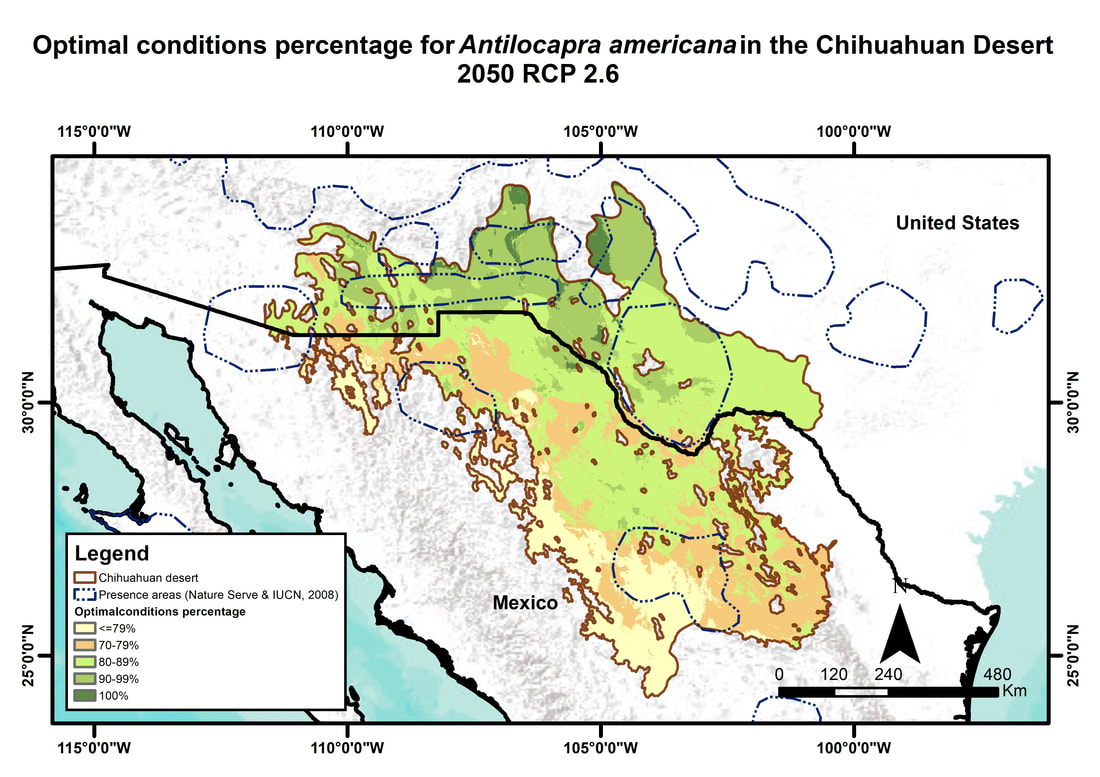
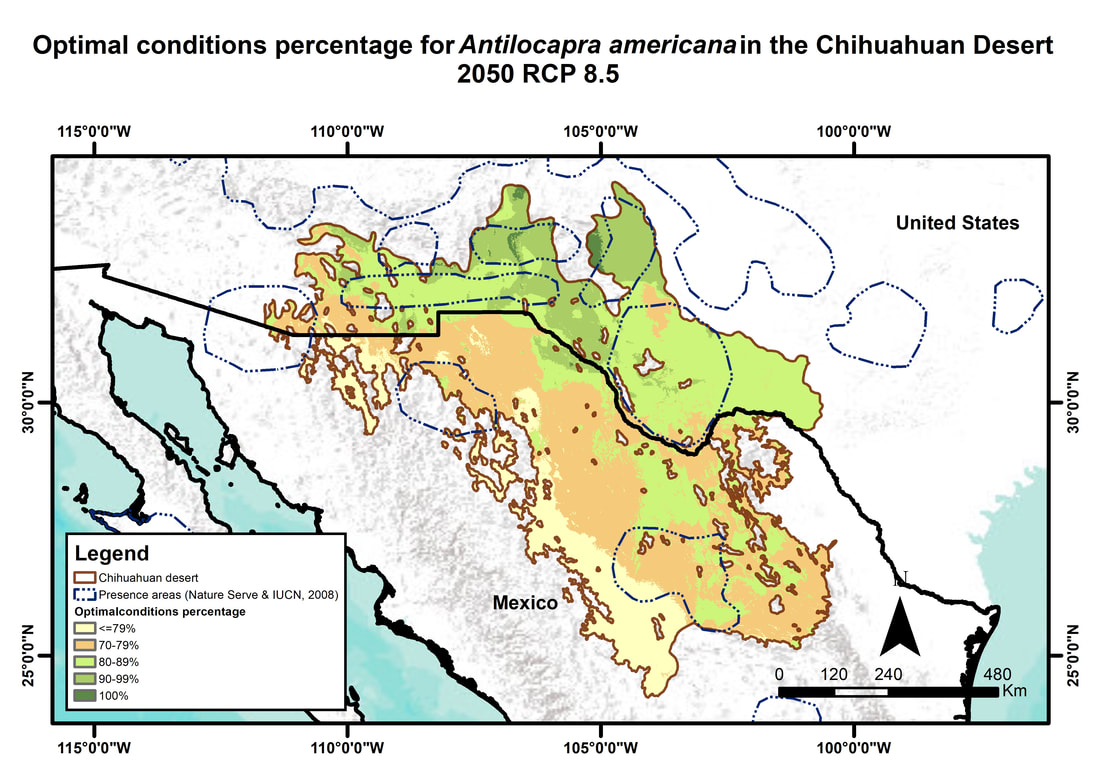
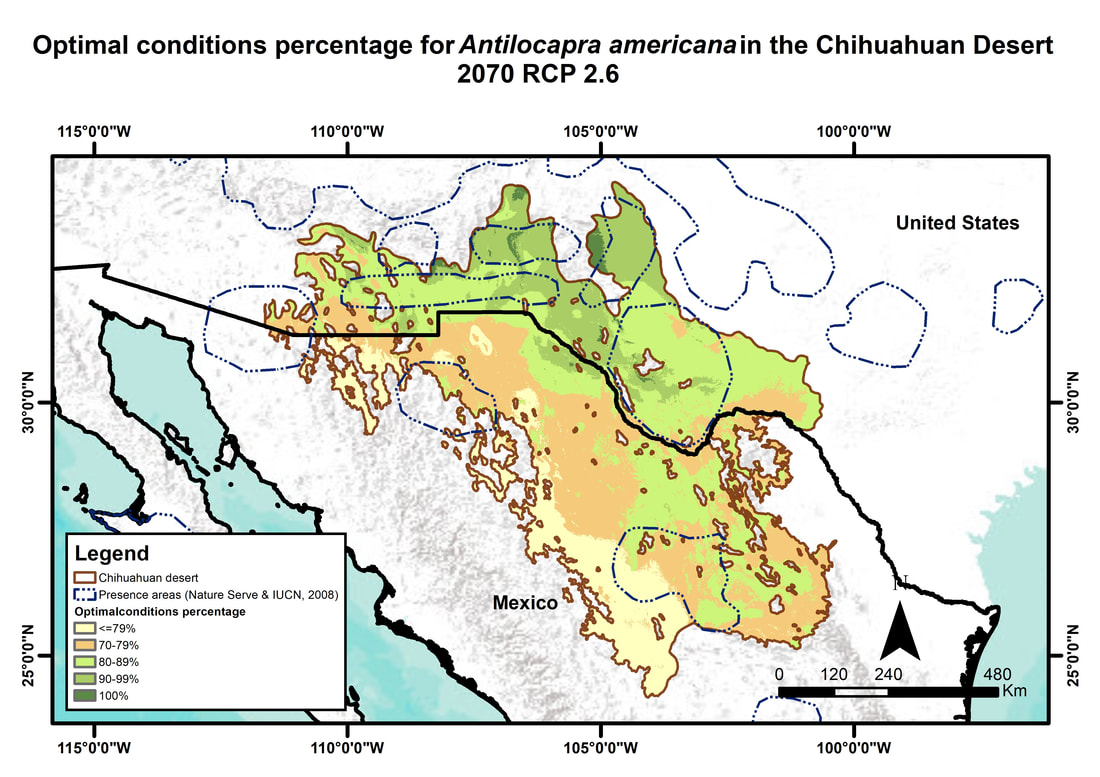
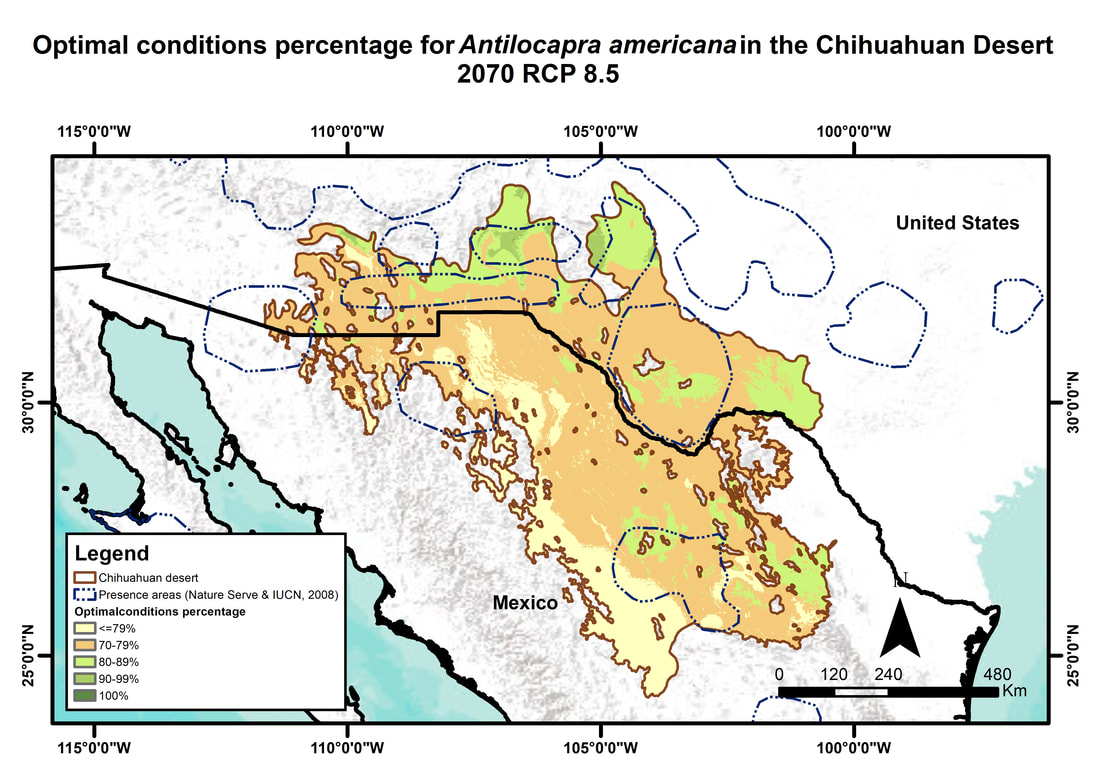
The results revealed that the future climate will remain warm and wet, a condition that would be favourable for forest productivity. Furthermore, we observed a diminution in the distribution of sites that are highly suitable for the species. Conversely, sites that are less suitable for the species increased in proportion. The observed change in range in the distribution of suitable sites is an evidence of the potential impacts that climate change will have on the distribution of tree species. Pronghorn (Antilocapra Americana Ord) is considered an endangered species on the International Union for Conservation of Nature (UICN) Red List, with the least concern status due to the pressure of human activities on its habitat (land-use changes) and population (hunting and trapping). Climate change is also a factor that can influence the spatial distribution and survival of species such as pronghorn. We present an application of a species distribution model (SDM) we developed to assess the potential effects of climate change on the suitable areas for pronghorn in the Chihuahuan Desert by 2050 and 2070 using the RCP2.6 and RCP8.5 scenarios provided by the Intergovernmental Panel on Climate Change (IPCC). The results show potential significant negative effects on the survival of the pronghorn population due to climate change, as well as a contraction of its current suitable areas and a shift of them in the northern part of the Chihuahuan Desert. It is forecasted that areas with 100% optimal conditions will shrink from 631,000 km2 in 2020 to 525,000 km2 in 2050 (-17%) and to 230,000 km2 in 2070 (-64%). The SDM can help identify suitable areas and strategic corridors for the conservation of this endangered species.
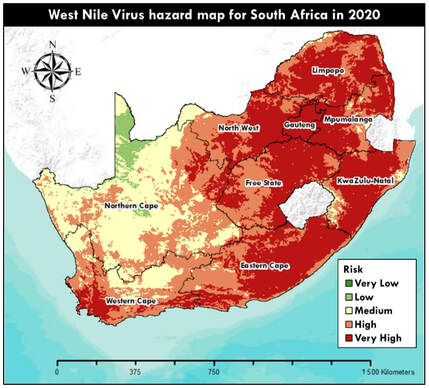
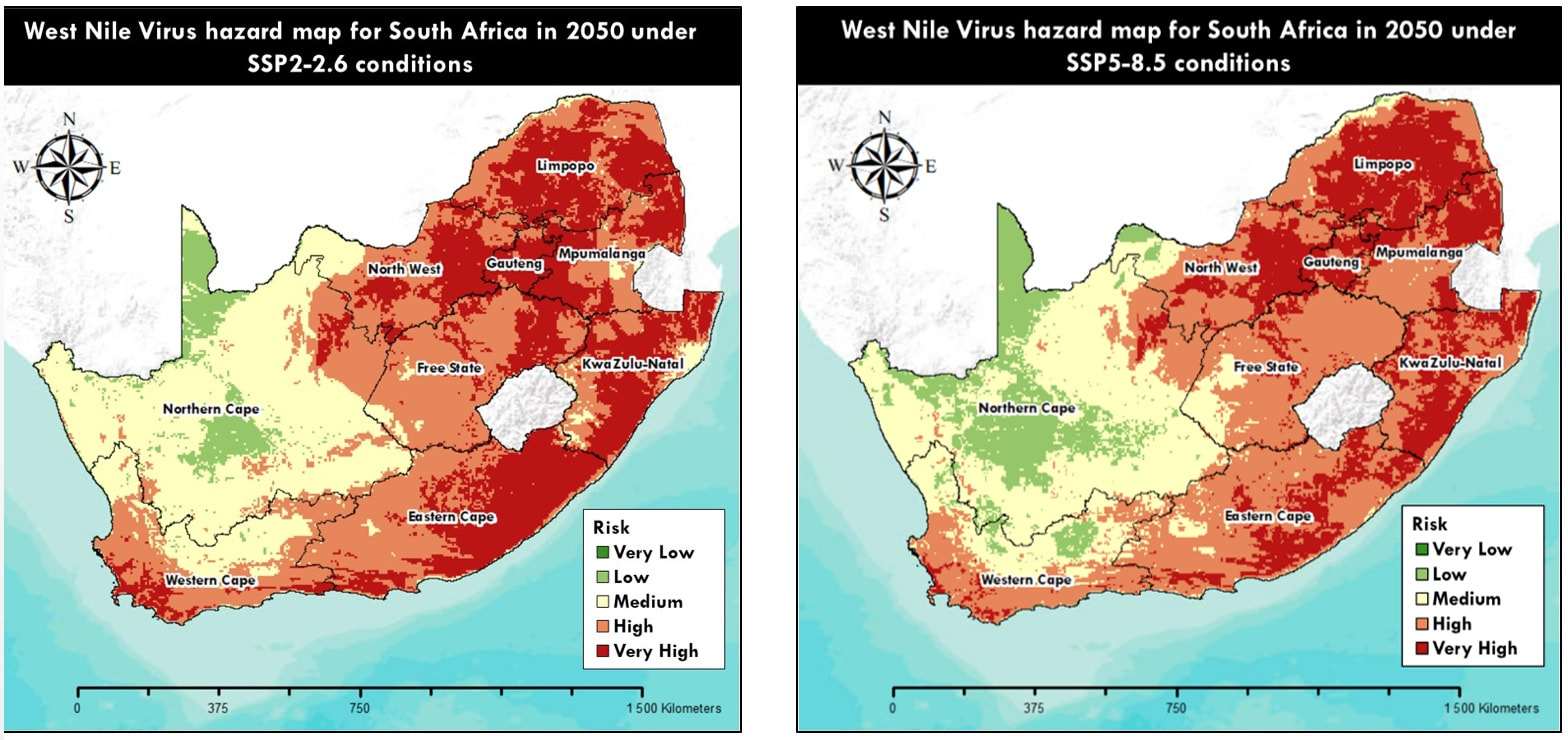
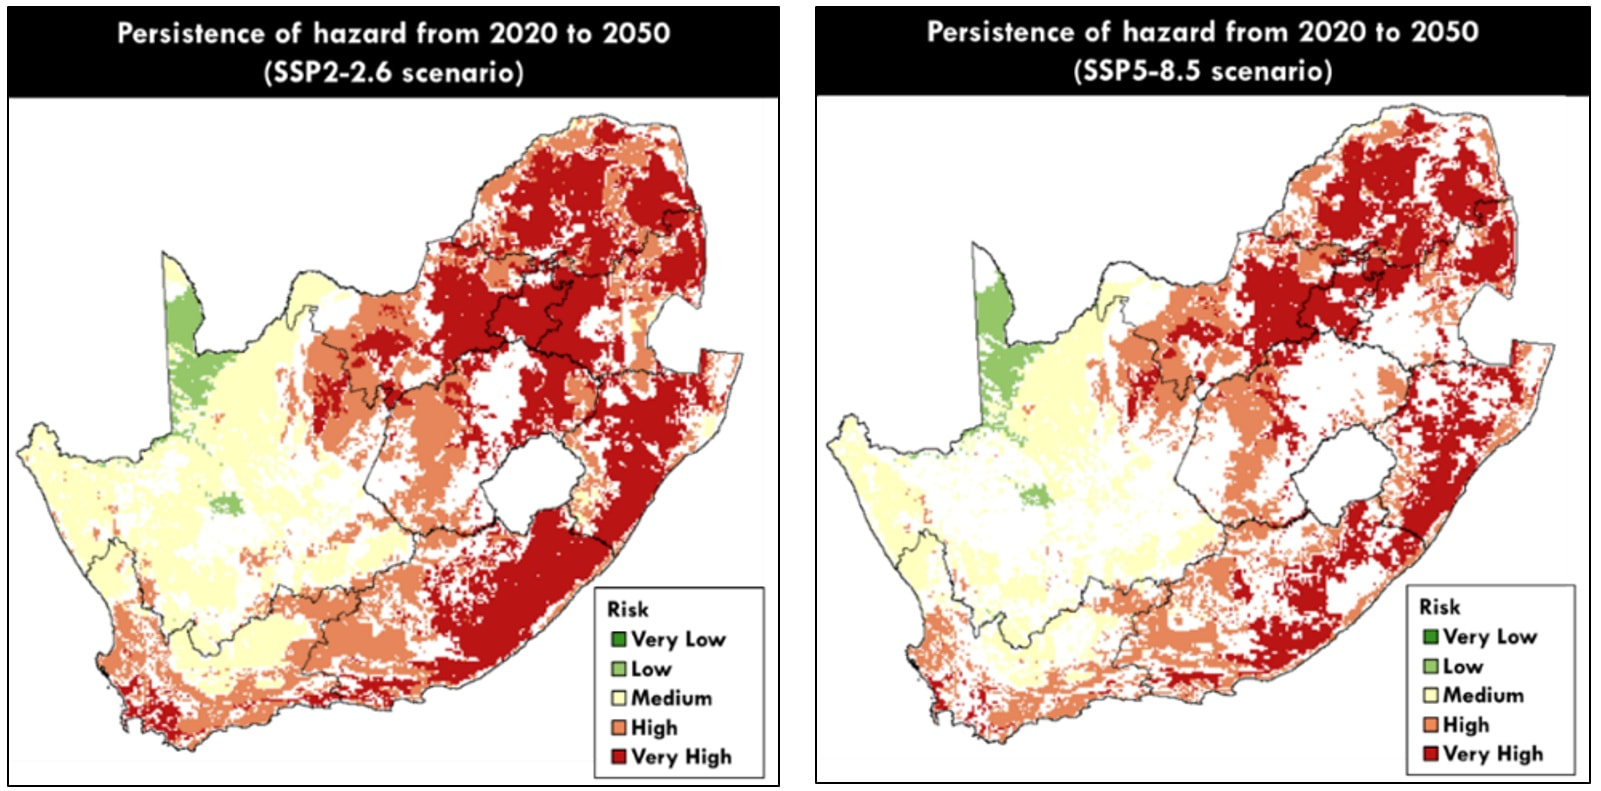
A West Nile Virus (WNV) outbreak in South Africa would be difficult for public health authorities to control because (1) it is not restricted to current malaria risk areas, (2) has no vaccine for people and (3) is not surveyed mostly due to its asymptotic nature in people. We assessed the potential impact of climate change on the WNV transmission for 2050 in South Africa by applying an Ecosystem Based Approach and land cover change modeling. Major environmental, climatic and social indicators that influence vector and host behavior in the WNV transmission cycle were integrated in a GIS environment and Climate Data Science toolbox (Species Distribution Model – SDM). Hazard and vulnerability maps were created and combined to create risk maps that highlighted the country’s risk to the WNV currently and in 2050 under SSP2-2.4 and SSP5-8.5 scenarios. The results indicate that climate change has minor positive and negative impacts regionally while the persistence of risk remains in several urban cities and municipalities, along the coastline and in the central plateau. As a hazard, the presence of WNV is very high across the country while vulnerable regions are focused around urban areas. The province of Gauteng is of most concern of a WNV outbreak and the Northern Cape is of least concern.
A recent scientific paper in Molecular Ecology Resources (https://onlinelibrary.wiley.com/doi/abs/10.1111/1755-0998.13289), published this month, suggests that Perennial Ryegrass (Lolium perenne L.) may find difficulties to adapt to climate change in Mediterranean areas. This research is based on Genome‐Environment Association (GEA) and GWAS analyses. We propose here to compare their results, by using our SDM (Species Distribution Model) named “Climflora”. Our model is based on the probabilistic calibration of Perennial Ryegrass observations in 5.000 plots in France, with 67 climate and soil variables. We estimated the probability of finding suitable areas for Perennial Ryegrass in France, at a spatial resolution of 1km for the current situation and for 2050 and 2100 RCP6.0 scenario. Our results show similar trends with the results of Blanco-Pastor et al. (2021) according to the opportunity to Lolium perenne L. to find suitable areas in 2050 and 2100 in the south part of France. Observations of Lolium Perenne L. and suitable areas according to current climate. Suitable areas in 2050 AND 2100 RCP6.0 DIFFERENCE BETWEEN TLALOC© DATA AND ALADIN© Climate change models are useful in order to provide the potential evolution of global climate at different time scales, like 2050 or 2070 etc. and for different scenarios of GHG (greenhouse gases) emissions levels and concentrations in the atmosphere. These scenarios are provided at different spatial resolution, like 225 X 225 km, 50 X 50 km, 12.5 X 12.5 km etc. by using climate downscaling models. We present here a comparison between 2 maps of 2 datasets for minimum temperatures (temperatures of the night) for the scenario RCP4.5 in January. The data coming from ALADIN model, provided by METEO France, have a spatial resolution of 8km. The data coming from our model (CDS toolbox TLALOC) have a spatial resolution of 5m. We let you imagine what it would be possible to do with such data in order to assess the resilience of your territory (ecosystems dynamics, biodiversity, risk assessment and management...), activities (forestry, agriculture, pasture, management of compensation areas, Nature Based Solution for Climate Change Adaptation...), infrastructures and urban planning (expansive soils hazards, material fatigue…), health (allergies, heat waves...) etc. We can help you for the development of a resilient business! T MIN JANVIER 2050 RCP 4.5 IPCC reports identified a potential general increase of wildland fires according to climate change scenarios in different ecological situations for 2050 and 2100. In France, more than 6.800 municipalities are exposed to wildland fire, which represents 19% of the amount of municipalities. According to the official data on municipalities exposed to such hazard, France has seen an increase of 900 municipalities between 2010 and 2019, from 5900 to 6800, which represent a progression of 13% of municipalities exposed to wildland fires. We propose a bioclimatic approach in order to assess the potential spread of such hazard. The model is based on the distribution of suitable areas for bio-indicators of wildland fire. These bio-indicators com from bibliographic review and field observations. Then, we define a group of plants that gathers 154 trees (like Pinus halepensis, Arbutus unedo, Acacia dealbata etc.), shrubs (like Lavandula stoechas, Pistacia lentiscus, Cistus albidus etc.) and herbs (like Brachypodium ramosum, Psoralea bituminosa, Aphyllanthes monspelliensis etc.) that are very often exposed to wildland fire. In that way, it is possible to consider these species as indicators of potential risk of wildland fire in the territories where they are observed or where they should grow. We also characterized the ecological niche of these 154 taxa by using climatic data coming from WorldClim model (with a spatial resolution of around 1km), soils types and pH levels coming from the European Soils Bureau Database. We estimated the average probability to find suitable areas for these bio-indicators for the current situation and for 2050 and 2100 by using IPCC RCP6.0 scenarios. We also selected the plots where the probability of suitable areas for wildland fire indicators is equal or greater to 0.5, in order to have at least one chance out of two to find territories exposed to such event. In order to validate our bioclimatic model, we overlap the estimate for the current situation with the layer of municipalities that have declared at least one wildfire episode in France since 40 years. We identified that 84% of the current municipalities at risk gather significant probabilities of suitable areas for bio-indicators of wildland fire. Then we can consider that our model has an average of 16% of uncertainty. Applied for the current and future situations, we can estimate the amount of potential vulnerable municipalities taking into account the level of uncertainty:
The evolution of the most suitable areas for 154 indicators of wildland fire risk shows a potential spread in the whole territory. Current to 2050 Estimated vulnerability of the territory to wildland fire for 2050, RCP6.0 scenario.
2050 to 2100 Estimated vulnerability of the territory to wildland fire for 2100, RCP6.0 scenario.
These results underline a potential increase of wildland fire risk spread in the French territory due to the potential spread of suitable area for plants that are often involved in such hazard. This trend would be located in the northern part of the territory and in highest altitudes than the current period. En Ardèche la culture de la châtaigne est une activité très importante qui date du 13ème siècle. Actuellement la production moyenne annuelle est de 5000 tonnes sur une superficie approximative de 6000 hectares. Le rendement moyen par hectare est de 1 ton/ha avec une densité moyenne de 80 arbres à l'hectare. Selon notre modèle, le changement climatique pourrait avoir un impact très significatif sur les conditions écologiques et bioclimatiques (en vert foncé) qui permettent la distribution, croissance et production de cette espèce et de ses variétés. D'après notre modèle de distribution potentielle (SDM) à très fine résolution, les zones où se trouvent actuellement les exploitations (en rouge), pourront être affectées vers 2050 selon le scénario RCP. 4.5., de manière que la productivité actuelle pourrait être compromise significativement. Par conséquent, cette filière nécessite une évaluation de la résilience de la culture et du business model face au changement climatique. Cliquez sur la carte interactive.. Assessing expansive soils evolution under climate change for promoting resilient urban planning2/19/2021
The building and insurance sectors consider that Expansive Soils is one of the most significant risk for buildings and urban planning. Different strategies are used in order to avoid or mitigate this hazard but, before applying these techniques, it is necessary assessing the potential areas exposed to such hazard on a territory. In the perspective of developing sustainable and resilient buildings, this assessment must be carried out by taking into account current and future environmental situations. We propose a model based on geological and climatic data in order to assess the potential exposure of buildings in a territory in France. We also use our climatic downscaling model named TLALOC in order to estimate the soil moisture level at 5m of spatial resolution. We also selected the geological layers considered are at risk of soil expansion, according to their content in clays and hydromorphic minerals (smectite, vermiculite etc.). The following maps show the current exposure of building in the area of the cities of Aubenas and Privas in Ardèche department (France), for the current and future situation, according to the RCP4.5 scenario provided by the IPCC. The results show a potential evolution of soils expansion in 2050 according to the current situation.
They show a general increase of the level of risk for the buildings and many areas. We present here the evolution of the amount of building exposed to soil expansion hazard according to the current and future situations at Aubenas. We take into account three levels of exposure. The quantitative results show a shift of building exposure to higher level or risk for the future. This info can help decision makers in order to manage such hazard and risk at local level. |
AuthorCDS Geoprospective Science |


 RSS Feed

